⚽ Feature Selection in AI: Like Building a Winning Football Team
When building a machine learning model, not all variables (features) play the same role.
Think of it like a football team: each player can decide whether to be on the field or not. Some players (variables) are game-changers, others might add noise. The art of feature selection is knowing which ones to bring into play.
This is where SHAP (Shapley Additive exPlanations) comes in.
🔎 Why SHAP?
Derived from cooperative game theory, SHAP computes the contribution of each feature by considering all possible combinations of features. In simple terms: it tells us how much each variable really contributes to the final prediction.
Mathematically, SHAP values fairly distribute the “credit” of a model prediction among all variables, accounting for interactions.
✨ Additive Explanation:
A prediction can be broken down into:
👉 Base value (average prediction across the dataset)
👉 + Contributions from each feature (the SHAP values)
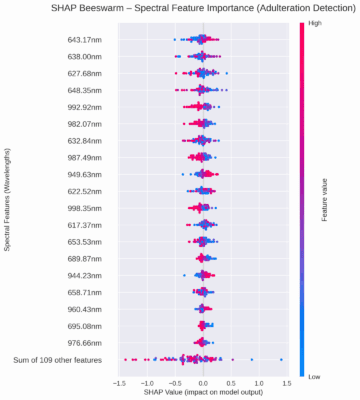
📊 Visualization with Beeswarm Plots:
-
Y-axis: Features (e.g., NIR wavelengths) ordered by importance.
-
X-axis: SHAP values, showing how each feature pushes predictions toward “adulterated” or “pure.”
-
Color: Feature values (low to high).
For example: if 600 nm shows high positive SHAP values (red dots), it indicates that strong absorbance at 600 nm is linked to adulteration (like water content from syrups).
💡 Why does this matter?
-
Locally: SHAP explains why one specific honey sample was classified as adulterated or not.
-
Globally: it highlights which spectral regions are most influential overall, directly linking predictions to chemical properties (like O-H bonds).
In food authenticity research, this level of explainability builds trust — bridging the gap between black-box AI and domain knowledge.