
UMAP: A Geometric Approach to Dimensionality Reduction
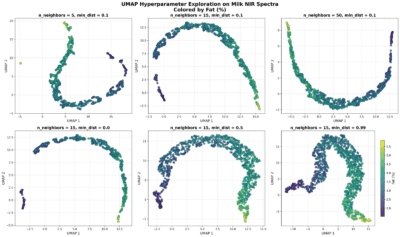
These six plots show how UMAP represents the structure of NIR milk spectra when coloured by fat percentage. UMAP builds a low-dimensional map by preserving neighbourhood relations from the original high-dimensional space, using ideas from topology to capture the underlying shape of the data.
Parameters such as n_neighbors, min_dist, the distance metric, and the number of UMAP components strongly influence how the map looks. Small n_neighbors emphasise local structure and can fragment the data; larger values highlight global trends. min_dist controls how tightly points can pack in the embedding: low values create dense clusters, while moderate values preserve continuous gradients like the fat content. The choice of metric (euclidean, cosine, correlation) determines how spectral similarity is computed, often changing the embedding completely. Finally, the number of components determines how many dimensions the embedding should have.
The theoretical foundation behind UMAP is highly interesting. Instead of reducing dimensionality through linear combinations, this algorithm focuses on the shape of the data. It can also account for datasets where distances between samples are not evenly distributed (which is not the case for this dataset, but it remains one of UMAP’s conceptual strengths).
Under well-balanced parameters, the fat gradient appears clearly and smoothly across the embedding, revealing the continuous chemical variation present in the spectra.
This source was extremely useful for understanding the UMAP algorithm in depth: https://lnkd.in/dJ-nwH-7
Data set: https://lnkd.in/e-q2YsXT