
Comparison of Mathematical Models to Predict Glass Transition Temperature of Rice (cultivar IRGA 424) Measured by Dynamic Mechanical Analysis (DMA)
Food S Food Science and Nutrition. · Jul 13, 2018
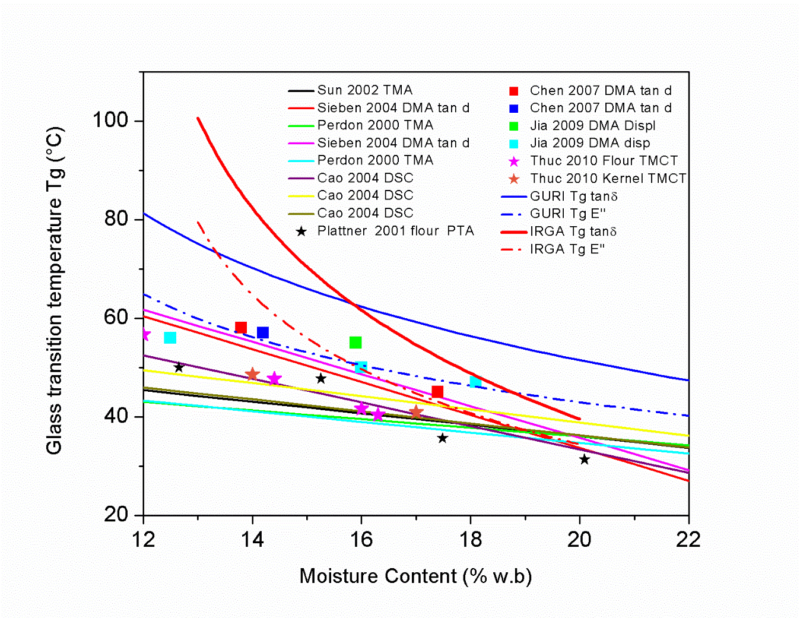
Dynamic mechanical analysis (DMA) was applied to measure the Tg of rice IRGA 424 at different moisture content values (9.3%–22.3% wet basis). To conduct temperature sweeps, the samples were heated at a rate of 2°C/min from 20 to 120°C keeping frequency to 1 Hz. Tg was measured both from the E″ peak temperature (Tgmidpoint) and from the tan (δ) peak temperature (Tgendset). Tgmidpoint and Tgendset increased from 31.8 to 86.6°C and 42.1 to 104.7°C, respectively, as moisture content decreased from 22.3 to 9.3%. Six models were tested for their ability to predict Tg as a function of the moisture content. As all residuals were normally distributed and homoskedastic, standard metrics were used to assess the fitted models. Goodness of fit by these models was established by comparing the coefficient of determination (R2), standard error of the estimate (SEE), and mean relative deviation (MRD). The Gordon–Taylor linearized equation was the most accurate in predicting Tg. To predict Tg from the moisture content of the rice samples, a new expression was proposed. For the conditions considered in this work, the developed equation satisfactorily predicts the Tg of rice IRGA 424 without needing prior linearization.Dynamic mechanical analysis (DMA) was applied to measure the Tg of rice IRGA 424 at different moisture content values (9.3%–22.3% wet basis). To conduct temperature sweeps, the samples were heated at a rate of 2°C/min from 20 to 120°C keeping frequency to 1 Hz. Tg was measured both from the E″ peak temperature (Tgmidpoint) and from the tan (δ) peak temperature (Tgendset). Tgmidpoint and Tgendset increased from 31.8 to 86.6°C and 42.1 to 104.7°C, respectively, as moisture content decreased from 22.3 to 9.3%. Six models were tested for their ability to predict Tg as a function of the moisture content. As all residuals were normally distributed and homoskedastic, standard metrics were used to assess the fitted models. Goodness of fit by these models was established by comparing the coefficient of determination (R2), standard error of the estimate (SEE), and mean relative deviation (MRD). The Gordon–Taylor linearized equation was the most accurate in predicting Tg. To predict Tg from the moisture content of the rice samples, a new expression was proposed. For the conditions considered in this work, the developed equation satisfactorily predicts the Tg of rice IRGA 424 without needing prior linearization.
M. Mercedes Bertotto1,2 | Analía Gastón3 | María J. Rodríguez Batiller4 | Pablo Calello2
1.
Faculty of Engineering, University of Buenos Aires, Buenos Aires, Argentina
2.
SENASA, National Service of Agrifood Safety and Quality, Buenos Aires, Argentina
3.
Faculty of Exact Sciences, Engineering and Land Surveying, CIC-UNR, IFIR (CONICET/ UNR), Rosario, Argentina
4.
National Council of Scientific and Technical Research (CONICET), Institute of Technology in Polymers and Nanotechnology (ITPN), Faculty of Engineering, University of Buenos Aires, Buenos Aires, Argentina
Correspondence
Mercedes M. Bertotto, Faculty of Engineering, University of Buenos Aires, Buenos Aires, Argentina.
Email: mbertotto@hotmail.com