🔹 What problem is AComDim trying to solve?You have spectral data (NIR, Raman, etc.) collected under a designed experiment: 🟢 Several factors (e.g., instrument, temperature, sample type, operator)🟢 Possibly interactions…
Lees verder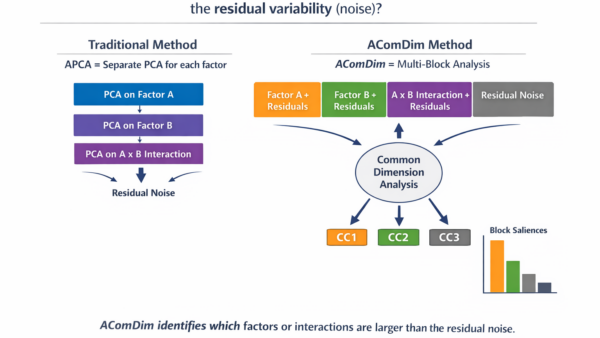
🔹 What problem is AComDim trying to solve?You have spectral data (NIR, Raman, etc.) collected under a designed experiment: 🟢 Several factors (e.g., instrument, temperature, sample type, operator)🟢 Possibly interactions…
Lees verder
These six plots show how UMAP represents the structure of NIR milk spectra when coloured by fat percentage. UMAP builds a low-dimensional map by preserving neighbourhood relations from the original…
Lees verderhttps://www.vibralytics.nl/wp-content/uploads/sites/617/2026/01/WhatsApp-Video-2025-12-08-at-13.51.37.mp4 In many data analysis projects, especially when dealing with complex soil spectra, the most time-consuming step is often not building sophisticated models, but rather thoroughly cleaning and preparing the…
Lees verder
Two-Criterion for Outlier Removal We have been diving deep into soil spectroscopy to predict key soil properties such as organic carbon, total carbon, nitrogen, clay, sand, silt, and bulk density.…
Lees verder
In NIR analysis, we have found spectral outliers, which we have removed using exploratory methods. However, we have also faced another challenge in this dataset: a severe imbalance in the…
Lees verderhttps://www.vibralytics.nl/wp-content/uploads/sites/617/2026/01/WhatsApp-Video-2026-01-09-at-10.35.37.mp4 We’ve been enjoying abundant snowfall here in the Netherlands, which reminds me so much of my stunning Patagonia… ❄️ What I find ABSOLUTELY FASCINATING about this research study, is…
Lees verder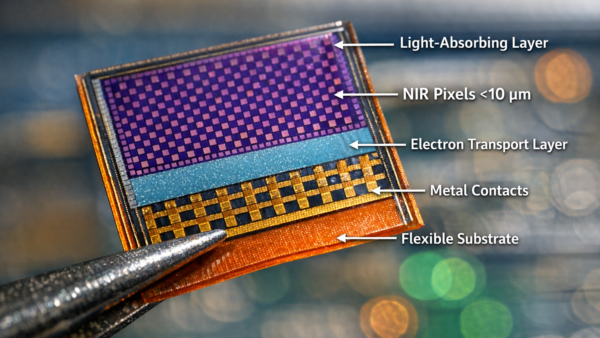
Did you know it’s now possible to PRINT infrared detectors smaller than 10 micrometers? 😮😮 In a recent study by Zhixuan Zhao and Ran An at the National University of…
Lees verder
Delicious, we can’t (and don’t want to) live without it. For many, it has been an integral part of daily life for thousands of years. 𝗬𝗲𝗿𝗯𝗮 𝗺𝗮𝘁𝗲 (𝗜𝗹𝗲𝘅 𝗽𝗮𝗿𝗮𝗴𝘂𝗮𝗿𝗶𝗲𝗻𝘀𝗶𝘀) is…
Lees verder
🙏 Special thanks to Esmael Ahmed for making the dataset openly available on GitHub and Auckland Figshare:
👉 https://lnkd.in/eyHdPrrR
This video showcases the optimization process for Artificial Neural Networks (ANN) and Convolutional Neural Networks (CNN) using Optuna, applied to NIR spectral data with various preprocessing treatments (e.g., RAW, SNV, Der1+SNV, Der2+SNV).
🔹 What’s in the video?
X-Axis: Learning Rate (LR) – Key to model convergence.
Y-Axis: Units/Filters in the first layer – Representing network complexity.
Z-Axis: Accuracy – Up to 1.0 in top models!
Colors: Blue for ANN, Red for CNN.
Animation: Rotates the 3D scatter plot to explore how hyperparameters evolve across treatments, revealing insights into which combos yield the best performance for detecting food adulteration.
This work highlights how AI can enhance chemometric analysis in food science, improving accuracy in identifying adulterants like those in oils, spices, or dairy products. CNN models often outperform ANN in spectral data, achieving near-perfect scores with optimal preprocessing!
If you’re in #NIRSpectroscopy, #AIFoodSafety, or battling #FoodAdulteration, let’s connect!