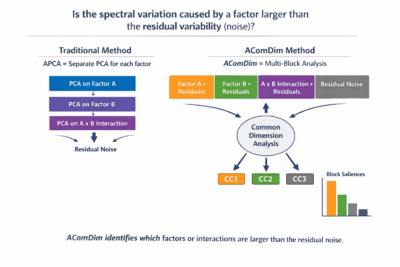
⭐ IS THE SPECTRAL VARIATION CAUSED BY A FACTOR (OR INTERACTION) LARGER THAN THE RESIDUAL VARIABILITY (NOISE)?
🔹 What problem is AComDim trying to solve?
You have spectral data (NIR, Raman, etc.) collected under a designed experiment:
🟢 Several factors (e.g., instrument, temperature, sample type, operator)
🟢 Possibly interactions between factors
🟢 Plus noise / uncontrolled variability
The key question is:
❓ Which factors or interactions truly drive spectral changes, and which variations are just random noise?
🔹 2. Traditional approach: ANOVA-PCA (APCA)
ANOVA-PCA decomposes the data into contributions from each factor and their interactions:
➡ Compute the mean spectrum for each factor level (or interaction level)
➡ Subtract these means from the data to isolate residuals (experimental error / noise)
➡ Add residuals back to each factor matrix
➡ Apply PCA separately to each factor + residuals matrix
➡ Examine the score plots to assess whether factor-induced variation is larger than residual variability
⚠ While APCA works, running separate PCA for each factor can be inefficient, especially for complex experiments with many factors.
🔹 3. Enter AComDim (ANOVA–Common Dimensions)
AComDim improves on APCA by using a single multiblock analysis instead of multiple separate PCAs:
Each factor (or interaction) and residuals becomes a data block. For example:
🟢 Factor A + residuals
🟢 Factor B + residuals
🟢 Interaction A×B + residuals
🟢 Residuals alone
AComDim applies ComDim (Common Dimensions) across all blocks simultaneously:
1️⃣ Compute a weighted sum of covariance matrices for each block
2️⃣ Extract the first common component (CC) that maximizes shared variance across blocks
3️⃣ Determine the weight (“salience”) of each block on the CC
4️⃣ Remove the contribution of this CC from each block and repeat for the next CC
By examining saliences of the CCs, you can identify which factor or interaction is most important relative to noise.
🔹 Why is AComDim useful?
✅ Provides a single framework to assess multiple factors and their interactions in spectral data
✅ Quantifies whether factor-induced spectral changes are larger than residual variability
✅ Reduces the need for multiple separate PCA analyses, saving time and improving interpretability
✅ Applicable to NIR, Raman, or other vibrational spectroscopy data in experiments